Southeast Michigan October 2020
Blog Search
Subscribe
Get the latest Michigan Housing Reports delivered straight to your inbox!

Available Listings
-10% from last month
New Pendings
-13% from last month
YTD Closed Sales
-7% from last year

YTD Avg Sale Price
+8% from last year
YTD Price Per Sq Ft
+6% from last year
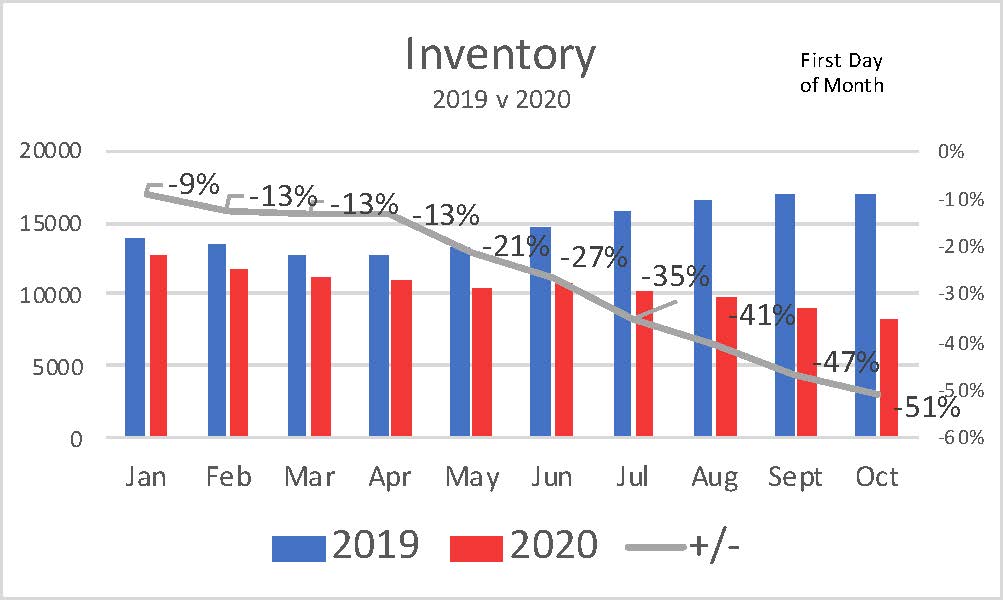
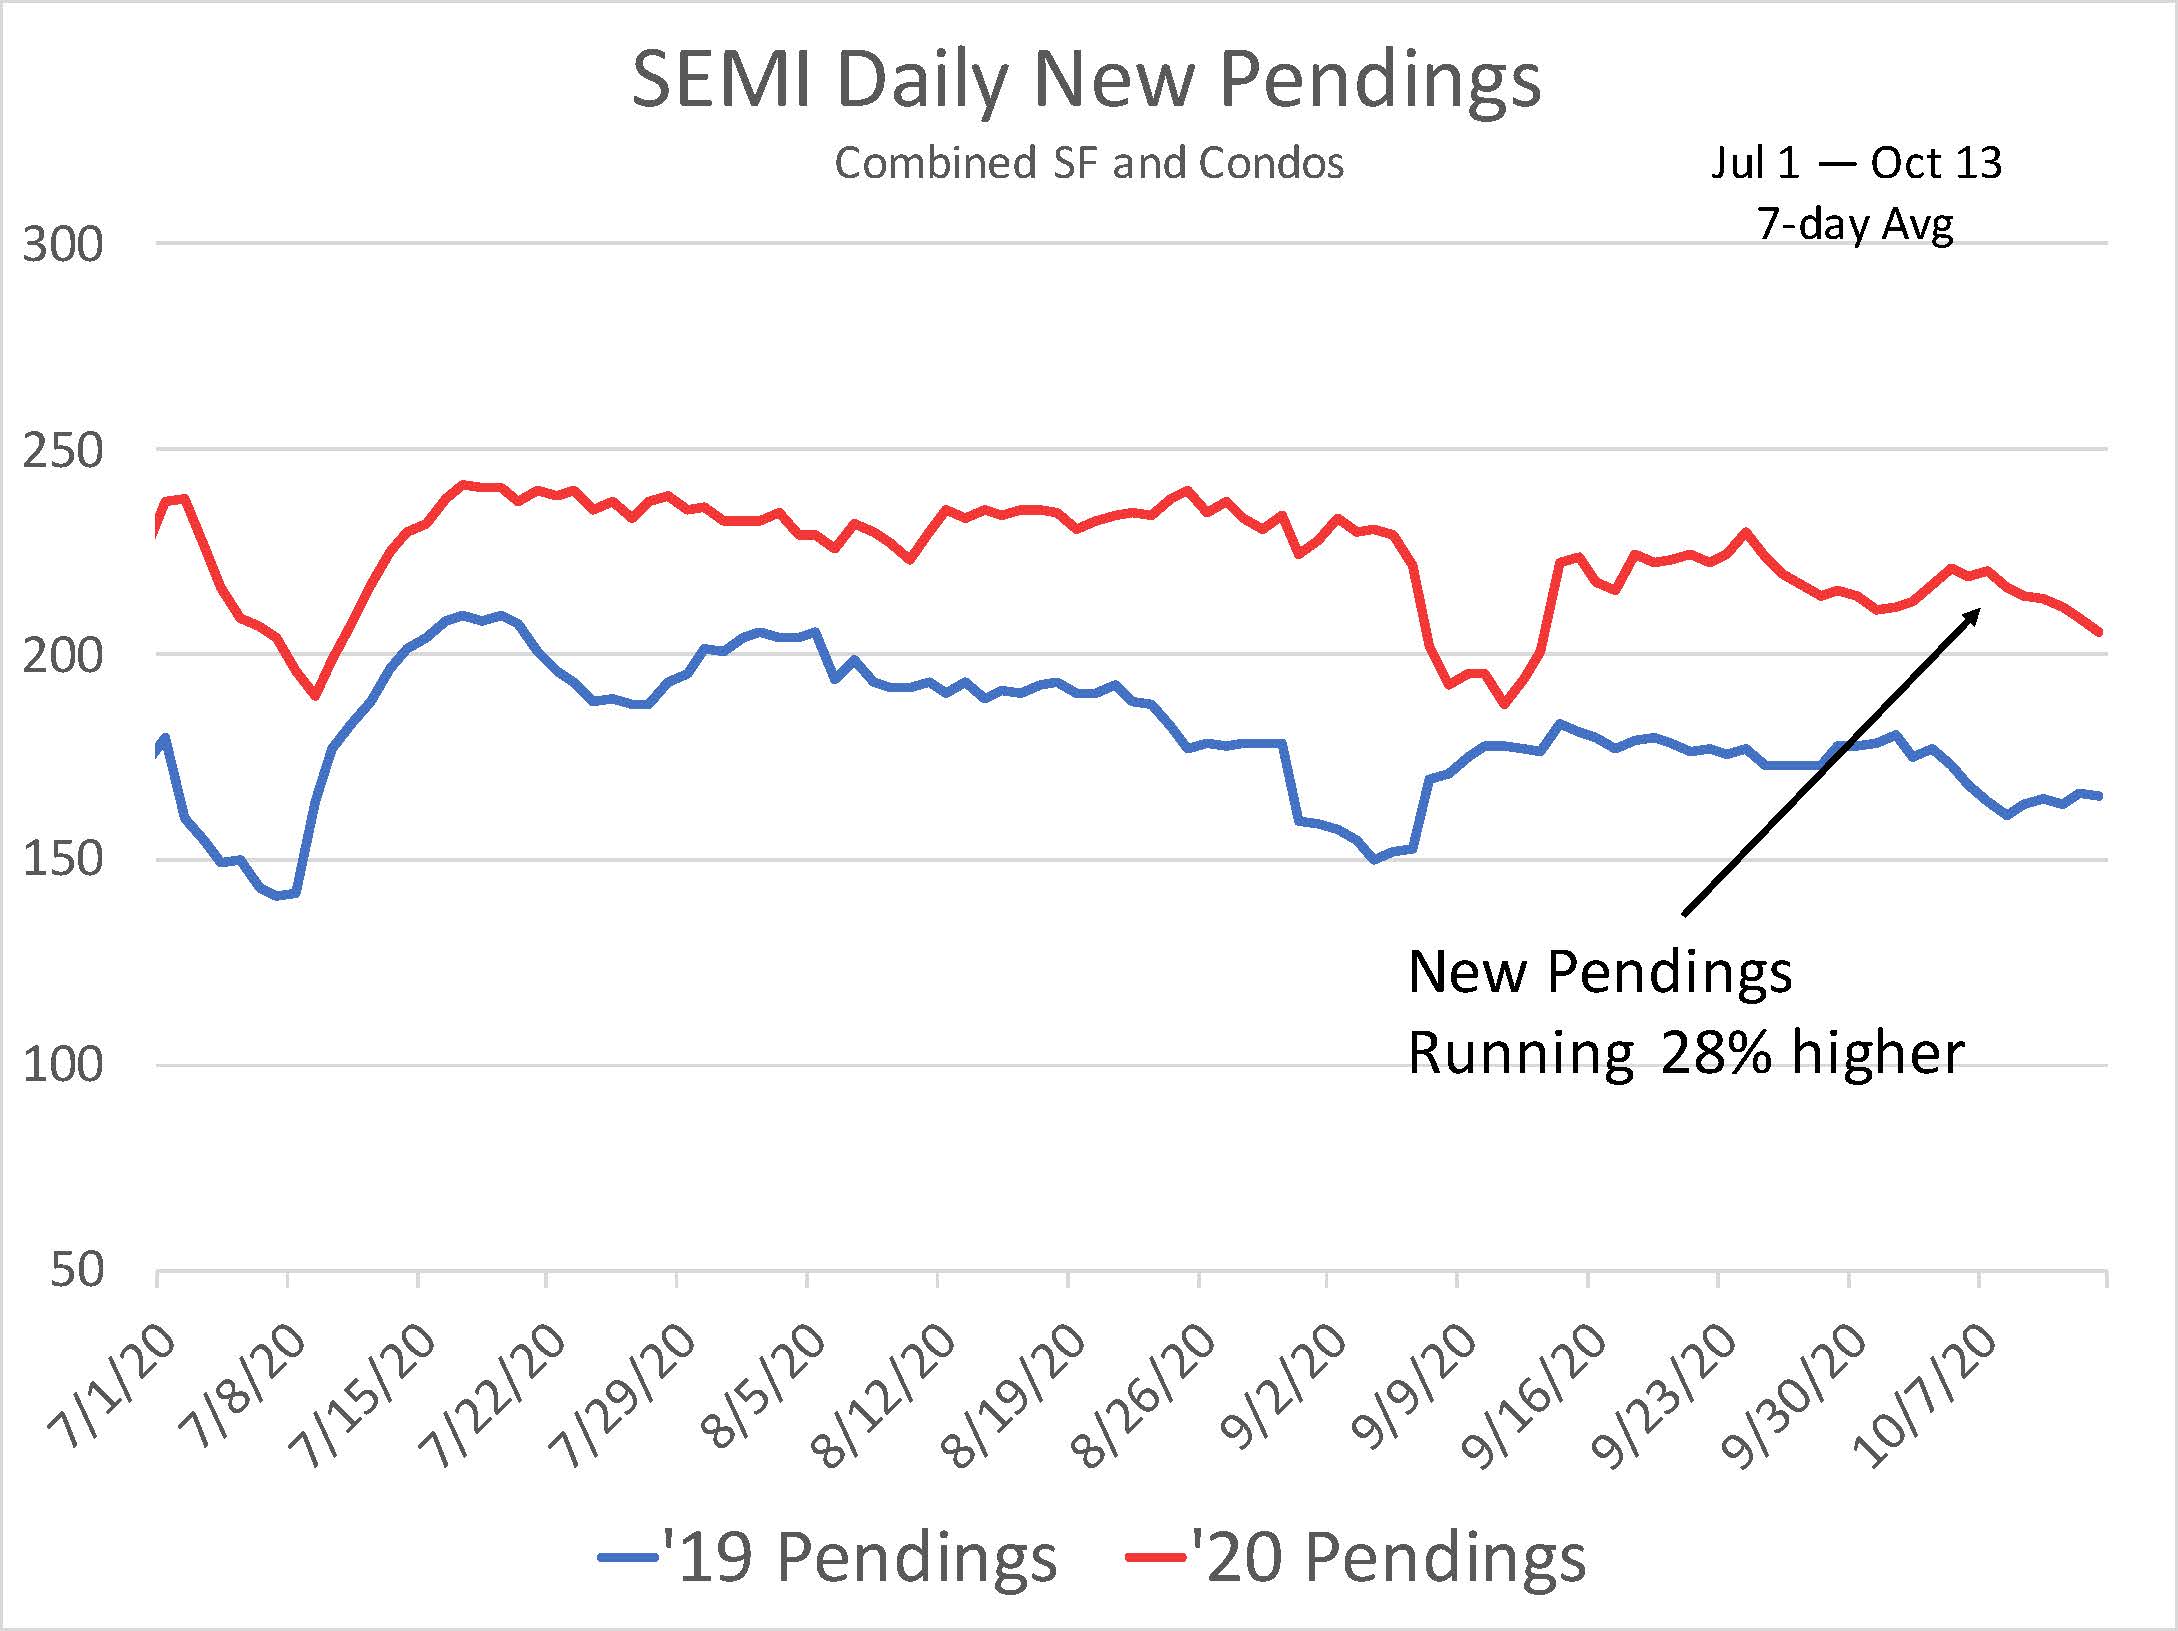
Market activity continues to be strong despite having half as many available listings as this time last year. September new pendings dropped off slightly compared to the prior month but were up 35% compared to last year. As seen above, daily new pendings continue to run nearly 30% higher than a year ago. YTD closed sales are down 7%, but that gap is narrowing (it was 12% last month) and closed sales should be even by the end of the year. Values continue to rise with YTD average sale price up 8% and price per square foot up 7%. The market continues to be strong as it’s started into the fourth quarter. It’s not too late for sellers to jump in and take advantage of the great market opportunities.

Market Rewards Well-Prepared Listings
< 1 minute
The Southeast Michigan housing market continues to settle into a healthier, more balanced pattern. Buyer activity remains strong, with new pendings rising 3% year-to-date despite new listings trailing last year [...]
Inventory Builds as Spring Market Takes Shape
< 1 minute
The Southeast Michigan housing market is moving into spring with many of the trends from earlier in the year still in place, now forming a clearer pattern. Compared to recent [...]
Growing Inventory Despite Fewer New Listings
2 minutes
Inventory continues to rise, even as fewer new listings are coming to market. Active listings are up 21% compared to a year ago, increasing from 5,300 to 6,500. At the [...]
©2026 Max Broock. All rights reserved.