Washtenaw County August 2020
Blog Search
Subscribe
Get the latest Michigan Housing Reports delivered straight to your inbox!

Available Listings
-1% from last month

New Pendings
+5% from last month
YTD Closed Sales
-15% from last year
YTD Avg Sale Price
+4% from last year
YTD Price Per Sq Ft
+1% from last year
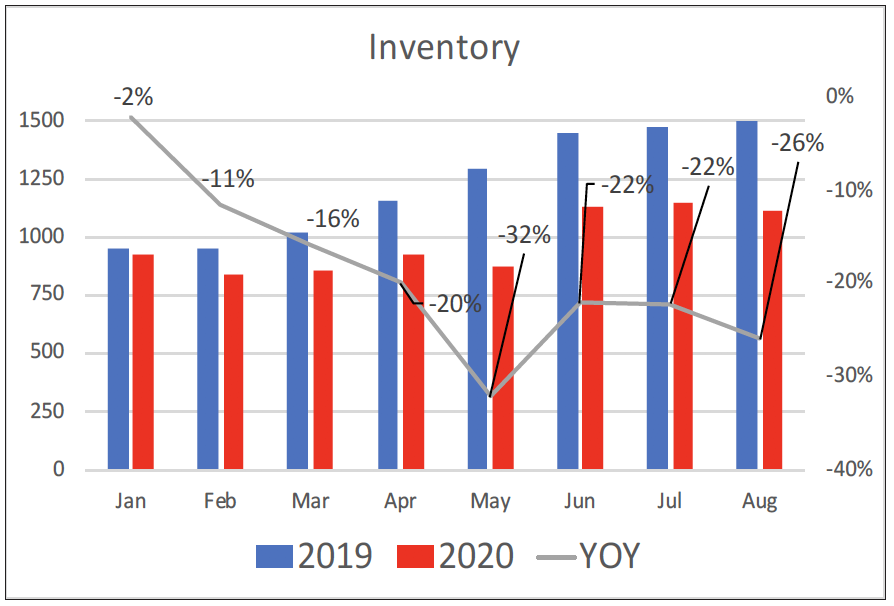
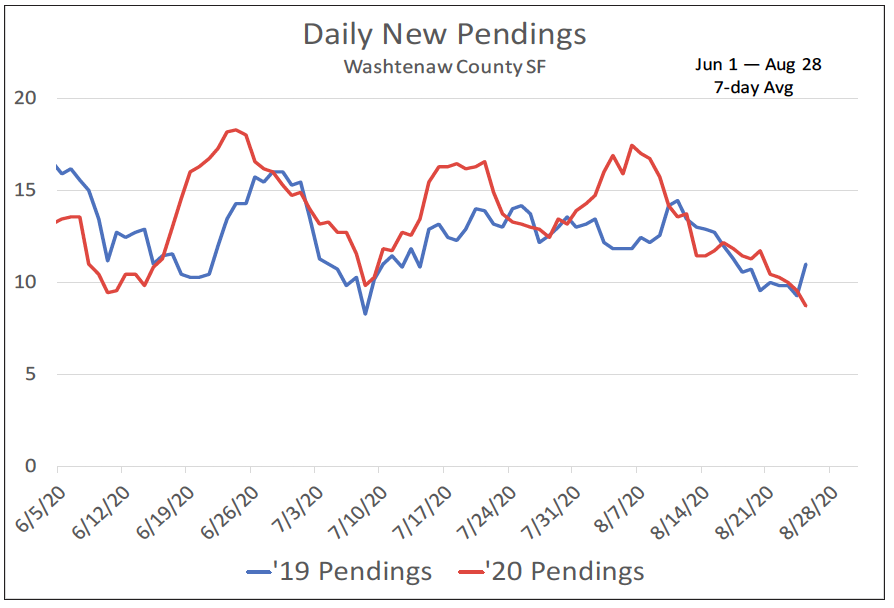
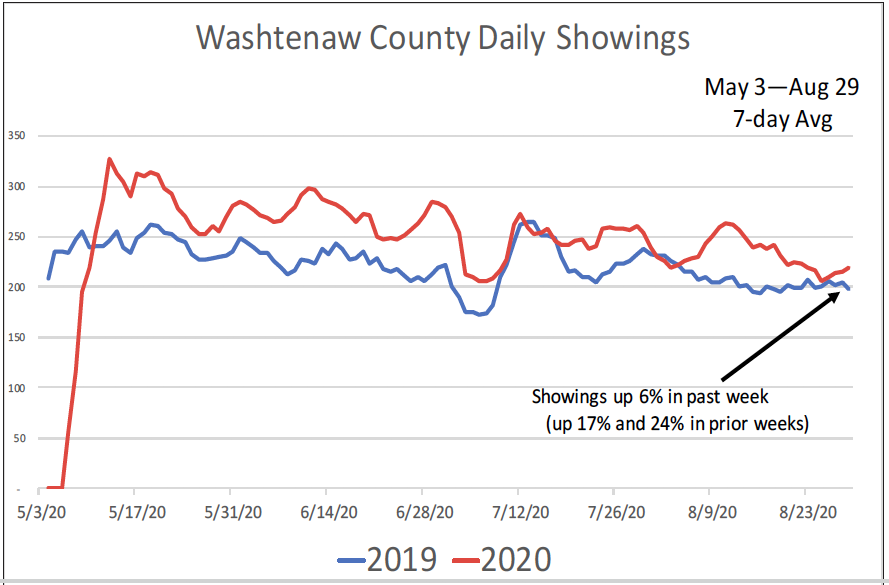
Although inventory is down 26%, both daily showing and new pending activity have been up compared to last year. July new pendings and closed sales were up 5% and 35% compared to the prior month and both were higher than the same month last year. August daily pendings have been declining. That slowdown will lead to a fewer September and October closed sales. YTD average sale price is up 4% compared to last year, but that’s mainly due to fewer low-priced sales in the mix. Price per square foot for closed sales over $300k is down 4%.

Demand Continues to Absorb Limited Supply
< 1 minute
The Washtenaw housing market continues to demonstrate remarkable resilience despite a persistent shortage of new listings. May new listings slipped 5% from April and remain 15% below last year’s pace, [...]
Limited Inventory Keeps Pressure on Buyers
< 1 minute
The Washtenaw County housing market continues to move through spring with buyer demand remaining stronger than overall sales activity would suggest. New listings remain well below last year’s pace, limiting [...]
Limited Supply Continues to Shape the Market
< 1 minute
The Washtenaw County housing market is moving through spring with buyer demand remaining strong, while limited inventory continues to constrain overall activity. Through the first quarter, new listings are down [...]
©2026 Max Broock. All rights reserved.